Let's Search
Please enter keywords...
Website Design Copyright©2026 ADDA Corporation. All Rights Reserved.
2026
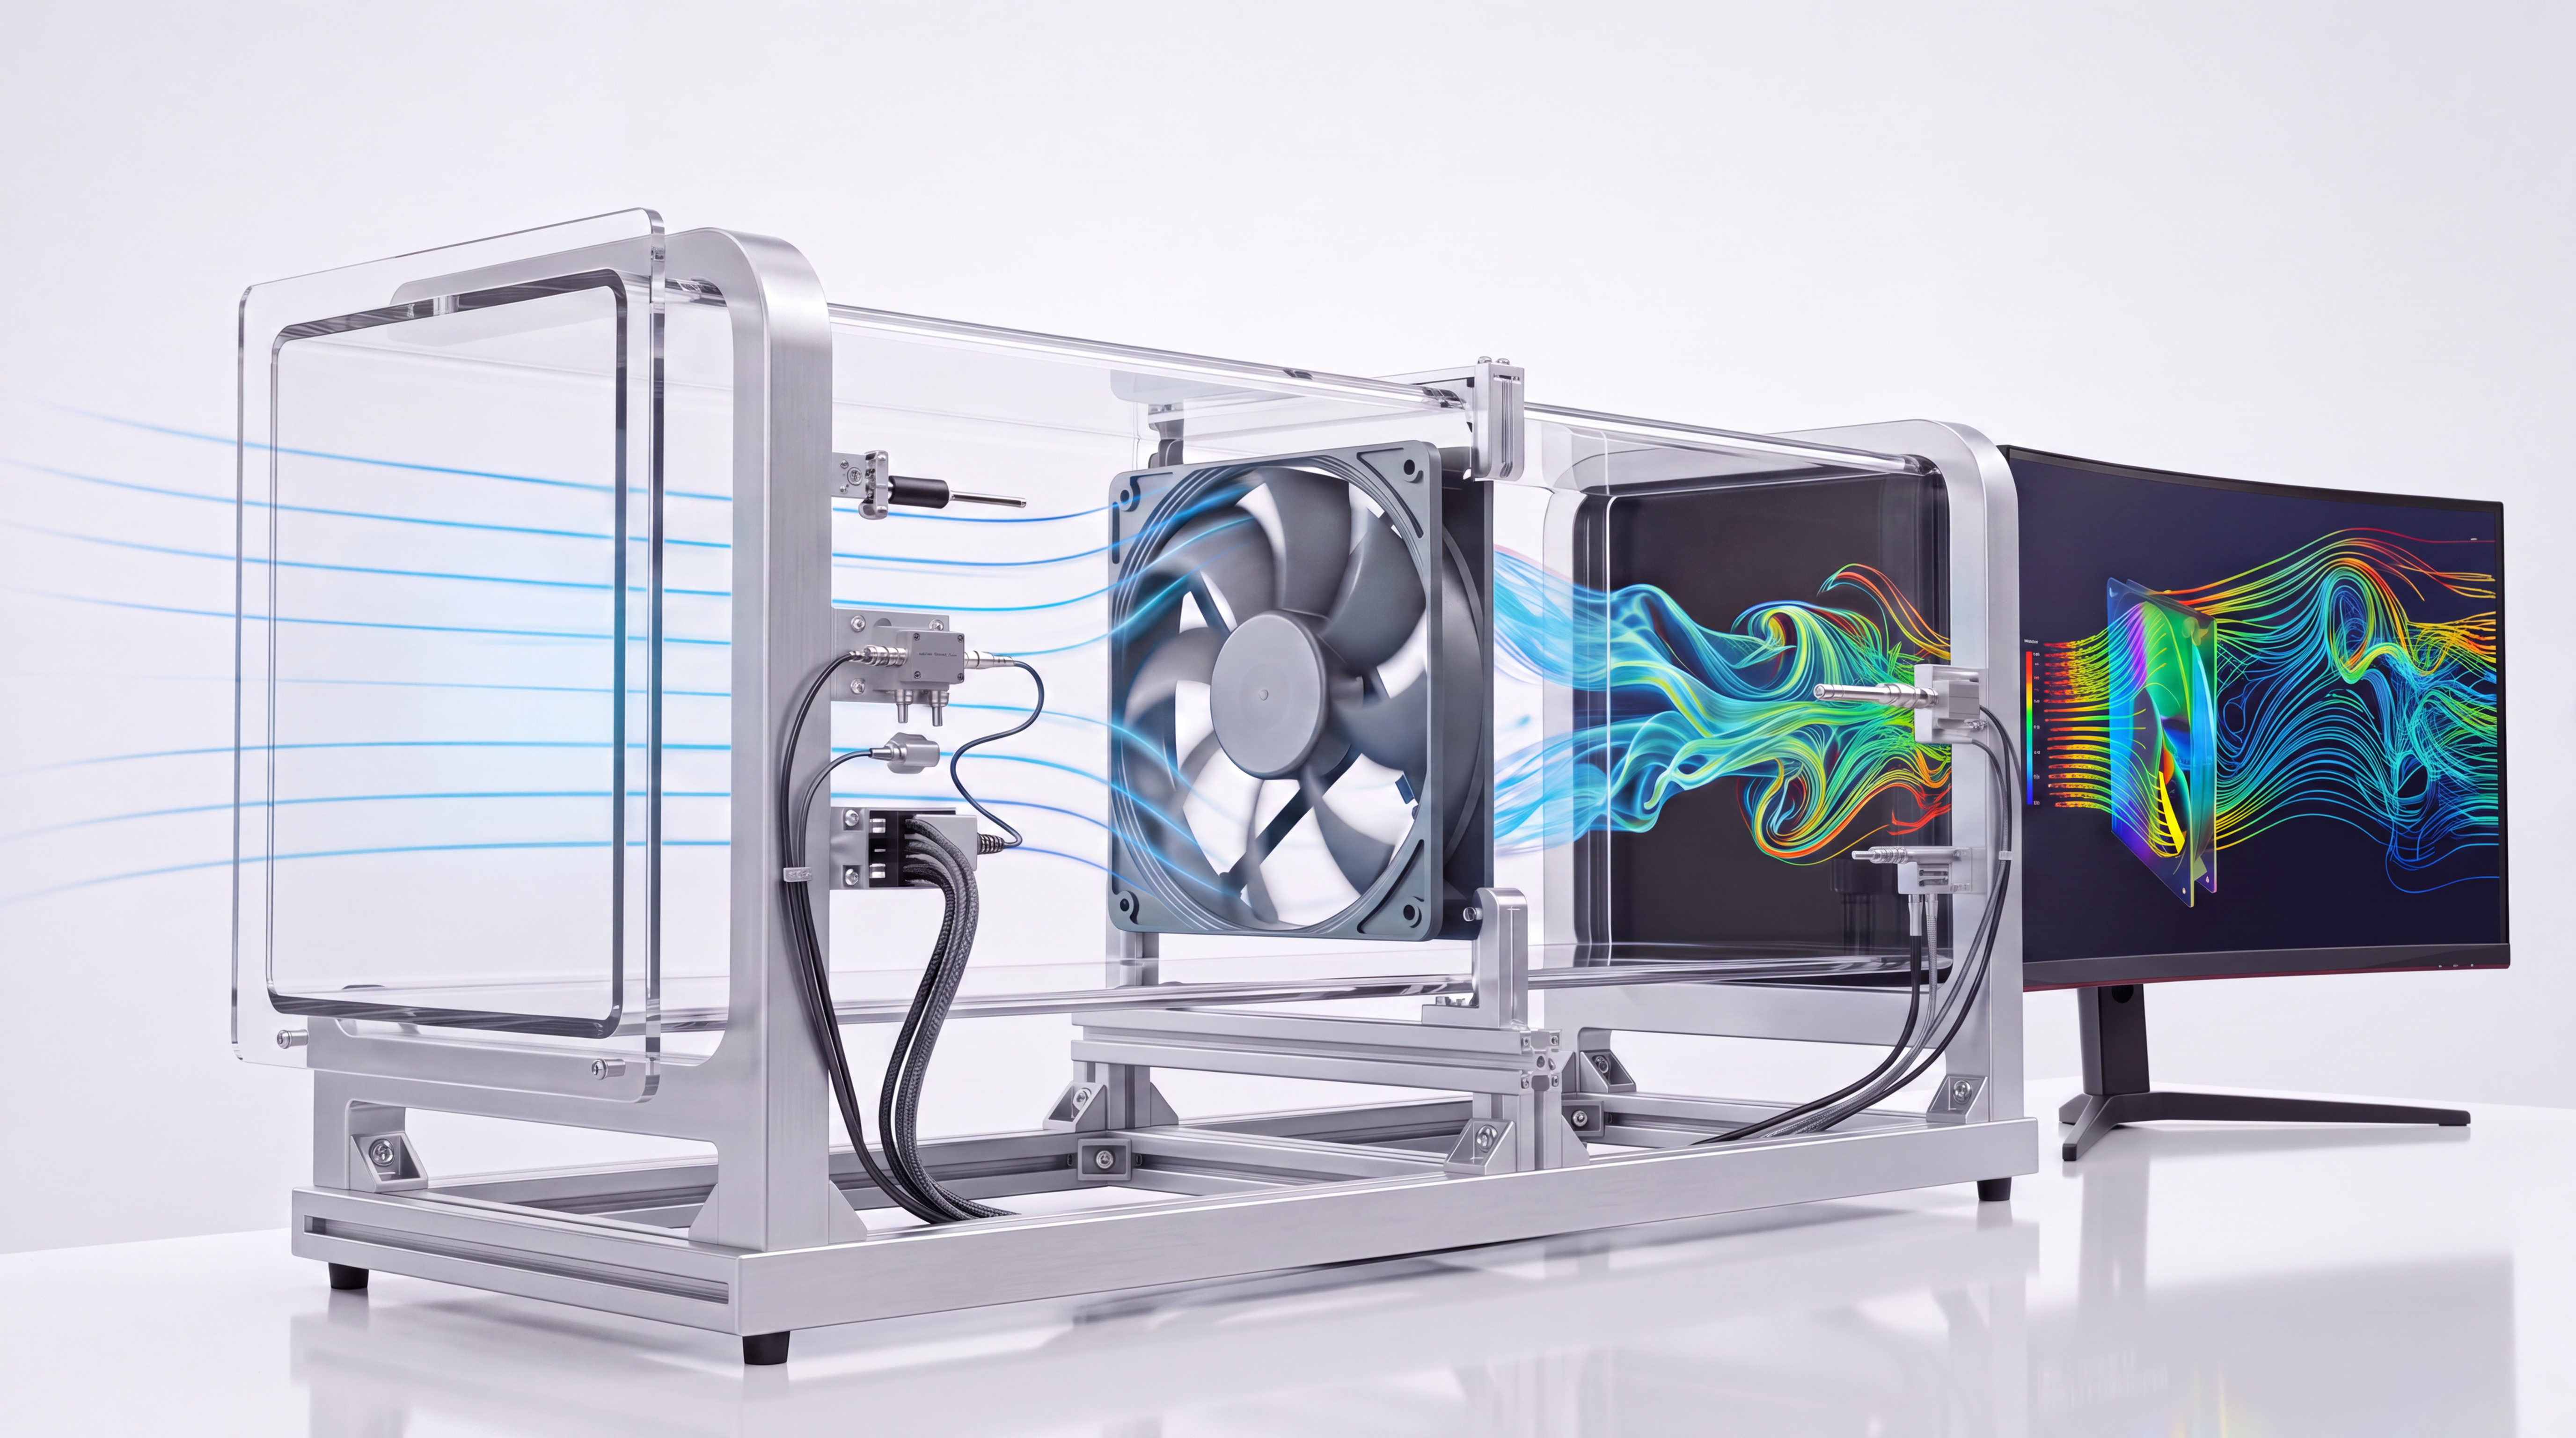
Selecting a cooling fan based solely on the maximum free-air airflow (Qmax) listed on the datasheet is a common pitfall, as Qmax represents an ideal test condition with zero system resistance. Once installed inside an enclosure containing heatsink fins, dust filters, and high-density components, the fan's actual airflow is determined by its operating point—the intersection of the fan's PQ curve and the system impedance curve. Selecting a fan without accounting for system resistance can lead to thermal throttling and excessive aerodynamic noise. This guide explains Airflow, Static Pressure, PQ Curve characteristics, and Operating Point calculations, providing practical engineering guidelines for selecting airflow-optimized and static pressure-optimized fans.
Datasheet maximum airflow (Qmax), measured in accordance with AMCA 210, represents the maximum airflow under free-air conditions, with zero system resistance. Once installed in a chassis, the fan must overcome resistance from physical obstructions along the airflow path, reducing actual airflow according to the system impedance curve.
Common Sources of System Resistance:
The combined effect of these restrictions increases system resistance, shifting the system impedance curve and changing the fan's operating point. As a result, the actual airflow can be significantly lower than the maximum CFM rating specified in the datasheet. This is an important factor in thermal design, as insufficient airflow can contribute to overheating and thermal throttling.
To accurately assess system resistance, engineers should measure airflow and the corresponding pressure drop under different operating conditions. By plotting the resulting system impedance curve and overlaying it on the fan's PQ curve, engineers can identify the operating point and evaluate the airflow available within the system.
Overall cooling performance depends on the required airflow for heat dissipation, system resistance, and the fan's operating point, which is determined by the intersection of the fan PQ curve and the system resistance curve.
Airflow is the volumetric flow rate of air, typically expressed in CFM or m³/h. It determines how much heat can be carried away by the airflow under specified thermal conditions.
Theoretical minimum required airflow is derived from the thermal balance formula: Q = q / (ρ · Cp · ΔT)
| Symbol | Meaning | Unit | Standard Value at Room Temp |
|---|---|---|---|
| Q | Required Volumetric Flow Rate (Airflow) | m³/s (convertible to CFM) | Calculated based on thermal requirements |
| q | Total System Heat Dissipation Power | W | Based on actual thermal load |
| ρ | Air Density | kg/m³ | Approx. 1.2 |
| Cp | Specific Heat Capacity of Air | J/(kg·K) | Approx. 1005 |
| ΔT | Allowable Air Temperature Rise (Tout - Tin) | °C | Defined per thermal specifications |
Airflow Calculation Based on Thermal Balance
Application Context: High-airflow fans are suited for applications requiring high volumetric airflow through relatively low-resistance paths, such as chassis exhaust systems and large electrical cabinet ventilation.
Static pressure (Ps), typically measured in Pa or mmH2O, represents a fan's ability to generate pressure to overcome airflow resistance within a system. It is particularly important in applications where air must pass through restrictive components or narrow flow paths.
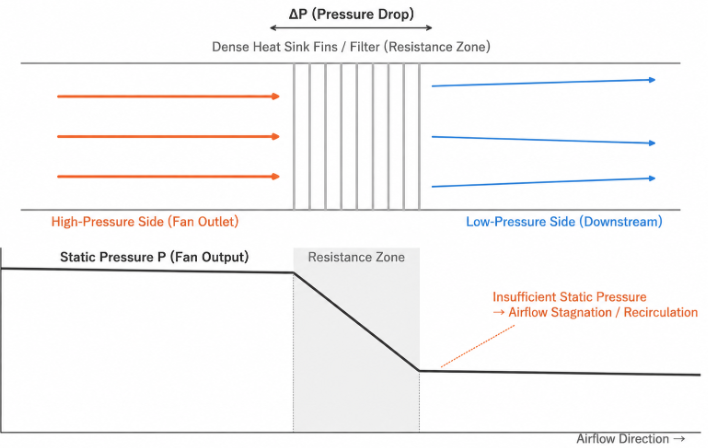
Static Pressure and System Resistance in Fan Applications
Diagram Explanation: The upper diagram illustrates airflow through restrictive components, such as dense heat sink fins and dust filters. Orange arrows indicate airflow upstream of the restriction, while blue arrows represent airflow downstream. The pressure difference (ΔP) across the restriction reflects the resistance to airflow.
The intersection of the system resistance curve and the fan's PQ curve defines the operating point, indicating the airflow and pressure the fan delivers under the given system conditions.
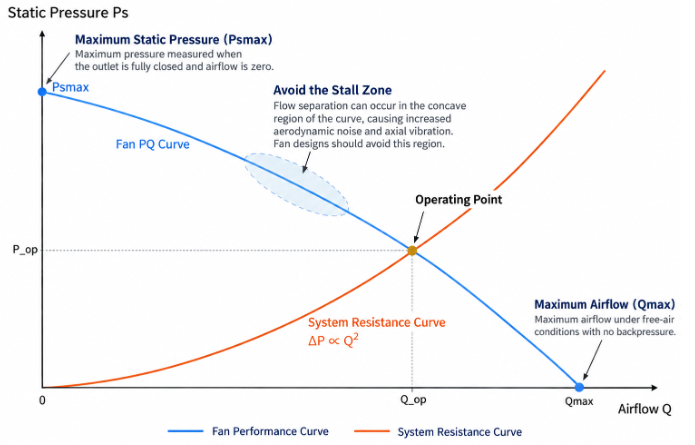
Fan PQ Curve and System Operating Point Diagram
The exact intersection point between the parabolic system impedance curve and the fan's PQ curve is the Operating Point, representing the true airflow and pressure output once installed inside the enclosure.
The system pressure drop (ΔPsys) generally increases with the square of the volumetric airflow (Q), under typical turbulent flow conditions: ΔPsys = K · Q²
(Where K is the system resistance coefficient, which depends on the geometry and characteristics of the airflow path.)
Two fans, each rated at 100 CFM under free-air conditions, can deliver significantly different airflow when installed in the same high-resistance chassis:
Once the operating point is determined, fan selection should consider the required airflow and static pressure under the system's operating conditions. The following matrix compares the key characteristics of high-airflow fans and high-static-pressure fans:
| Evaluation Metric | Airflow-Optimized Fan | Static Pressure-Optimized Fan |
|---|---|---|
| Fluid Dynamics Core Focus | • Maximize volumetric exhaust under zero backpressure • Achieve rapid thermal convection in open enclosures |
• Deliver high penetration force against high backpressure • Overcome pressure drop in narrow flow passages |
| Blade Geometry Features | • High blade count (7–9 blades) • Narrower blade profile with flatter pitch angle • Large effective intake sweep area |
• Lower blade count (5–7 blades) • Wide, thick airfoils with aggressive twist pitch • Minimized tip clearance between blade and frame |
| System Impedance Suitability | • Low-impedance systems (low K coefficient) • Spacious enclosures without internal flow obstructions |
• High-impedance systems (high K coefficient) • Compact enclosures with high-density component packing |
| Target Operating Point Zone | • Lower-right region of the PQ curve • Low static pressure, high volume stable region |
• Mid-to-upper region of the PQ curve • Mid-to-high static pressure, stable penetration region |
| Typical Application Examples | • Industrial electrical cabinet exterior heat exhaust • Ventilated server rack enclosures • Chassis secondary ventilation exhaust |
• 1U/2U high-density rackmount servers • Dense heatsink fins (fin pitch < 1.2 mm) • Liquid cooling heat exchangers, automotive control modules |
| Selection Error Risks | • Airflow collapses when installed in high-impedance cases • Flow blockage triggers stall noise and overheating |
• Excess power consumption when used in open spaces • Inadequate intake sweep area & unnecessary cost premium |
| Corresponding ADDA Series | AG Series | High-Airflow Cooling Fans | AS Series | High-Static-Pressure Cooling Fans |
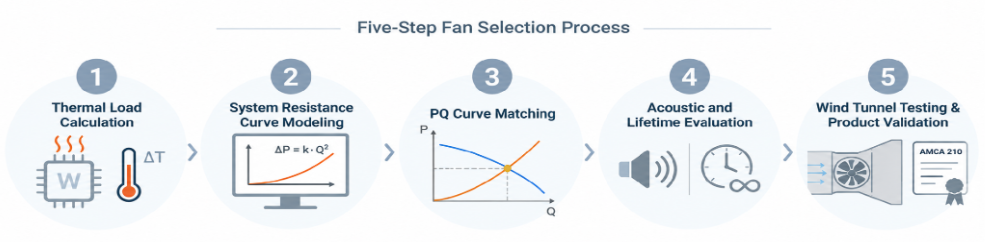
ADDA combines the AMCA 210 fan aerodynamic performance test standard with measured thermal-flow data to build a 5-step engineering selection framework—from thermal load, system resistance, and fan PQ curve to physical validation—helping engineers precisely select the right fan and cooling solution for their thermal requirements.
Five-Step Fan Selection Process
Project Background: A client developed an all-in-one AI-powered video conferencing system featuring a high-power NPU in a highly compact enclosure. The original fan provided insufficient cooling, while its aerodynamic noise and motor vibration interfered with the microphone array's DSP-based noise cancellation algorithms.
ADDA's thermal engineering team applied its five-step fan selection framework, working closely with system engineers and conducting iterative testing to achieve an optimal balance between cooling performance and acoustic performance:
Engineering Takeaway: Achieving the best balance between cooling performance and communication quality depends on accurate PQ operating point matching, combined with joint airflow and NVH spectrum tuning.
No. Datasheet CFM represents only the maximum free-air airflow at zero resistance; actual cooling performance depends on the airflow delivered at the operating point.
Heatsink fins and dust filters inside an enclosure inevitably create back pressure. If a fan lacks sufficient static pressure, airflow cannot penetrate these obstructions, and actual airflow can drop significantly. Therefore, thermal performance should be evaluated at the operating point, where the fan's PQ curve intersects the system resistance curve.
High-static-pressure fans are generally suitable for systems with narrow airflow passages, densely packed components, or restrictive dust filters.
Typical applications include 1U/2U rack servers, CPU/GPU heat sinks with fin spacing below 1.2 mm, liquid cooling radiators, and compact automotive electronic control units. High-static-pressure fans are designed to overcome greater airflow resistance and maintain sufficient airflow through restrictive cooling paths.
Engineers can use Computational Fluid Dynamics (CFD) software to develop 3D airflow models, estimate system resistance, and evaluate operating points by overlaying the system resistance curve with the fan's PQ curve.
By incorporating enclosure opening ratios, component spacing, and duct geometry into the simulation, engineers can estimate airflow resistance and predict the system's operating point. ADDA's thermal engineering team can provide standard 3D CAD models and fan PQ data to support preliminary thermal design and evaluation before physical prototyping.
No. Selecting a fan based solely on CFM may result in insufficient airflow under high system resistance, while focusing only on noise levels (dBA) may compromise cooling performance.
A comprehensive fan selection process should consider five key factors: required airflow based on thermal load, system pressure drop, the PQ curve operating point, operating temperature and bearing life (L₁₀), and acoustic performance. Evaluating these factors together helps achieve the required cooling performance while meeting noise and reliability requirements.
Not necessarily. Increasing fan speed can improve airflow and static pressure, but it also increases power consumption and may significantly increase noise.
Under the fan affinity laws, power consumption can increase approximately with the cube of rotational speed under comparable operating conditions. Before increasing RPM, engineers should evaluate the internal airflow path, system resistance, and fan operating point. Improving airflow distribution or selecting a fan with higher static pressure may provide a more effective solution, depending on the system's requirements.
In compliance with EU personal data protection laws, we are committed to protecting and providing you with control over your personal data. By clicking "Accept All", you allow us to place cookies to enhance your experience on this site, help us analyze site performance and usage, and enable us to deliver relevant marketing content. You can manage your cookie settings below. By clicking "Agree" you agree to the current settings. For more information, please visit the Privacy Statement.
This website uses cookies
In compliance with EU personal data protection laws, we are committed to protecting your personal data and providing you with control over it. By clicking "Agree", you allow us to place cookies to improve your experience on this site, help us analyze site performance and usage, and allow us to deliver relevant marketing content.
By clicking "Only necessary" you allow us to place only necessary cookies. The website cannot function without these cookies and you cannot switch them off on your system. These cookies are typically set only in response to an action you perform (i.e. a service request), such as setting privacy preferences, logging in, or filling in a form. You can set your browser to block or prompt you for these cookies, but this may prevent some site features from working.