Environmental Sustainability
ESG Technology Innovations,
Shaping a Sustainable Future
ADDA Corporation|The Authority in Cooling Solutions
Let's Search
Please enter keywords...
Website Design Copyright©2026 ADDA Corporation. All Rights Reserved.

Environmental Sustainability
ESG Technology Innovations,
Shaping a Sustainable Future
ADDA Corporation|The Authority in Cooling Solutions

Environmental Sustainability
ESG Technology Innovations,
Shaping a Sustainable Future
ADDA Corporation|The Authority in Cooling Solutions
01
02
SCROLL DOWN
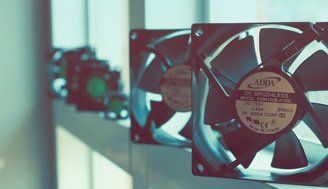
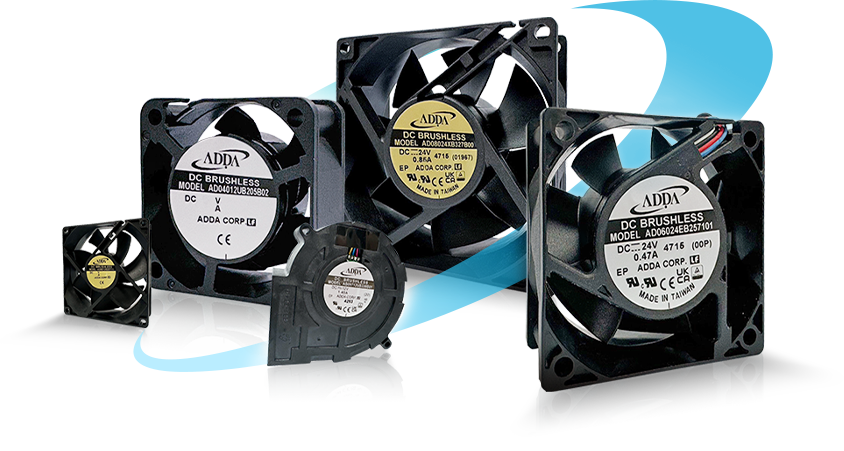
Thermal ManagementSolution
ADDA Corporation Specializes in Thermal Management Technology, Delivering Energy-Efficient Products
Our fans feature dustproof and waterproof designs, passing rigorous salt spray tests to enhance durability and reduce costs. With professional expertise, we are committed to sustainable business practices.
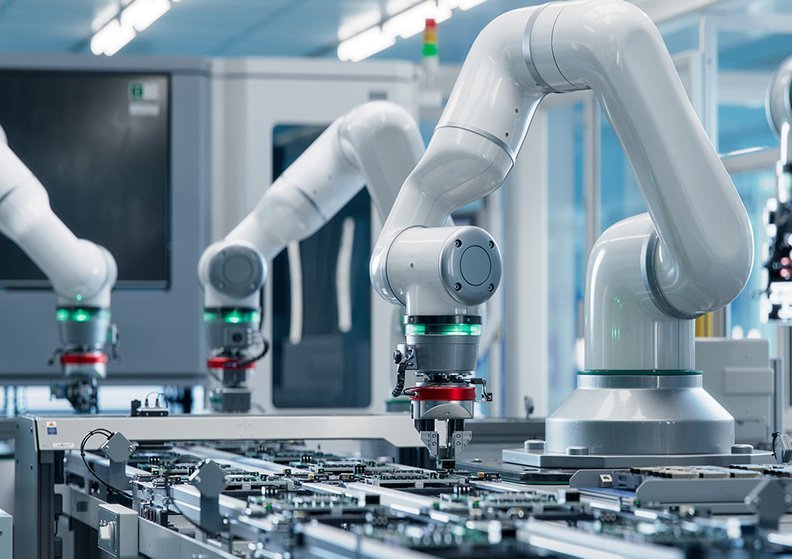


Automation Applications
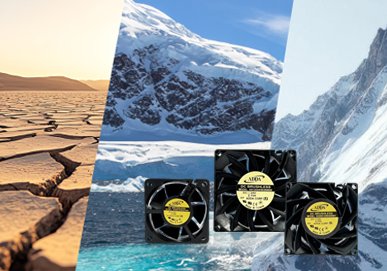
Special Protective Series
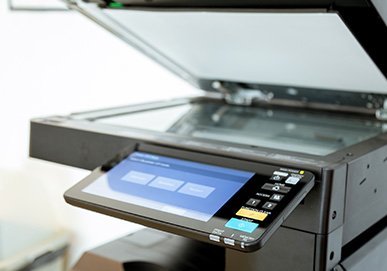
Office Equipment
ICT Equipment
Smart Sensing
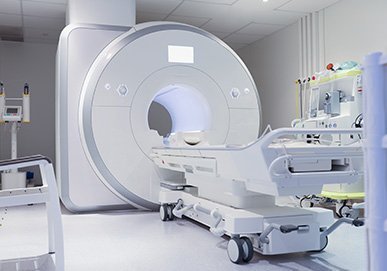
Smart Healthcare
Smart Home Appliances
Renewable Energy
Automotive Electronics
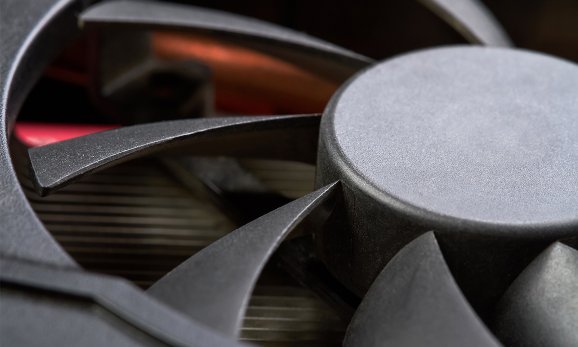
Cooling FansIntroduction
Versatile Dimensions to Suit Various Applications, with Customization Services Available
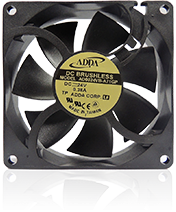
DC FAN
DC FAN
DC FAN
Size: 20mm ~ 172mm
Thichkness: 06mm ~ 51mm
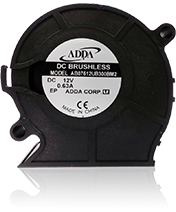
BLOWER
DC BLOWER FAN
DC BLOWER FAN
Size: 30mm ~ 120mm
Thichkness: 07mm ~ 33mm
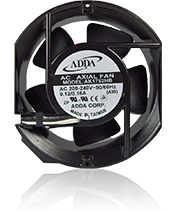
AC Fan
AC Fan
AC Fan
Size: 80mm ~ 280mm
Thichkness: 25mm ~ 89mm
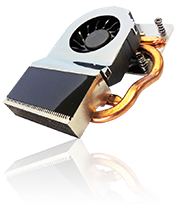
THERMAL SOLUTION
THERMAL SOLUTION / CHIP-COOLER / HEAT SINK
THERMAL SOLUTION / CHIP-COOLER / HEAT SINK
Size: 35mm ~ 50mm
Thichkness: 08mm ~ 10mm
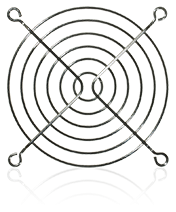
PERIPHERALS
PERIPHERALS
PERIPHERALS
Metal Finger Guard
Plastic Fillters 3-in-1
1|
4
Production Base
read more
100,000
Product Applications
read more
20~280
Model Dimensions
mm
read more
ADDA Corporation
Your Best Choice
read more
ABOUT ADDA
ADDA Corporation Leads the Industry in Electronic Thermal Management with 46 Years of Expertise With a state-of-the-art, self-owned factory spanning tens of thousands of square meters, we deliver stable and reliable production capacity. Guided by our vision of "Innovation and Leadership," ADDA continuously integrates R&D design, manufacturing technologies, and quality control. By uniting top-tier professional technical resources, we strive to build strong global competitiveness in manufacturing and sales.

Green Future, Sustainable Development
Implementing Low-Carbon Operations and Sustainable Energy Saving from the Product Perspective
Fully Adopting ISO-14064-1:2006 Greenhouse Gas Inventory, Certified by SGS
NEWS CENTER
In compliance with EU personal data protection laws, we are committed to protecting and providing you with control over your personal data. By clicking "Accept All", you allow us to place cookies to enhance your experience on this site, help us analyze site performance and usage, and enable us to deliver relevant marketing content. You can manage your cookie settings below. By clicking "Agree" you agree to the current settings. For more information, please visit the Privacy Statement.
This website uses cookies
In compliance with EU personal data protection laws, we are committed to protecting your personal data and providing you with control over it. By clicking "Agree", you allow us to place cookies to improve your experience on this site, help us analyze site performance and usage, and allow us to deliver relevant marketing content.
By clicking "Only necessary" you allow us to place only necessary cookies. The website cannot function without these cookies and you cannot switch them off on your system. These cookies are typically set only in response to an action you perform (i.e. a service request), such as setting privacy preferences, logging in, or filling in a form. You can set your browser to block or prompt you for these cookies, but this may prevent some site features from working.